Come with us to the shore !

CEM shore output – Analysis of the distribution of plant and animal biodiversity along the Porspoder shore by random transects
After reading this article your image of seaweed will change!
You probably have a bad image of seaweed because of the green tides and smelly seaweed at the top of the beaches. But seaweed is not only this slimy thing that you throw on your friends at the sea. Seaweed is an incredible diversity of shapes and a rainbow of colors under water. We are marine biology students and seaweed enthusiasts and we will introduce you to the fabulous world of seaweed, let us guide you on the Breton shore.
Presentation
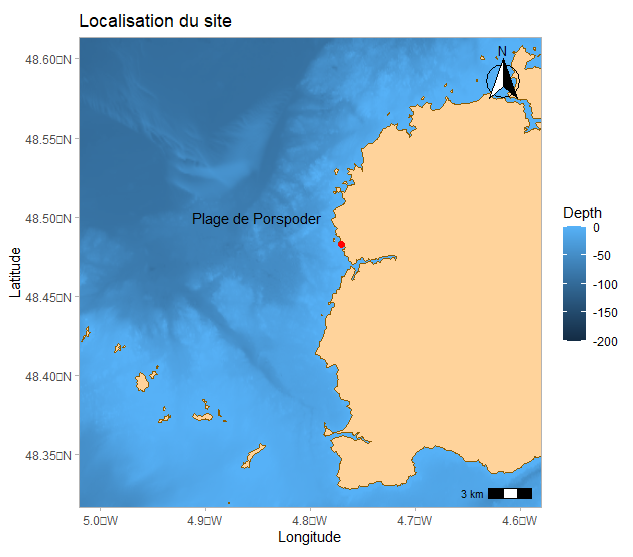
Valérie Stiger-Pouvreau presented the unit « Communities and marine ecosystems » and teached the ecological functioning of these ecosystems. We studied in detail the Brittany shores, areas under strong environmental pressures. The tides generate periods of immersion and emersion for the fauna and flora, which form different communities. The survival of shore organisms depends on their ability to tolerate different conditions of temperature, sunlight or to resist predation. We then went to the Porspoder shore, located in Finistère, to apply what we learned.
Brittany is « the place to be » to study the algal diversity because our shore is rich and beautiful.
Sampling and identification in the field
After packing our picnic and our field work equipment, we headed to the site by bus with Valérie Stiger-Pouvreau and Thomas Burel, shore experts.
As soon as we arrived, we had to quickly start working because the tide was rising fast. The purpose of the field work was to identify and record the fauna and flora found along the rocky shore. This allows us to study the distribution of communities according to their habitat characteristics.
Therefore, 6 quadrats (of 50 cm²) are placed in each of the 3 belts of the shore. We carefully recorded all the species found and determined their proportion in each quadrat. We then left with our loot before being caught by the tide.
The whole visit was fun because we were able to talk with the teachers in a less formal setting. Field trips are always a good way to bond with others and make new friends. And eating a picnic on the beach is always an awesome moment !
If you want to know more about the transect method we used to sample the shore, go here! And as a bonus, an interview with Thomas Burel!
Indoor sorting and identification
After the field work, we head to the lab to identify the unknown species found during the field trip. This is what we call taxonomy.
To do so, we use identification keys that index each species, animal or plant, according to its morphological characteristics. Moreover, we used microscopes and binocular magnifiers to see the smallest details that will allow us to discriminate between species that appear identical.
Having a wild Mathieu around to help us identify our seaweed is also very helpful ! He is a former student of our master and a real connoisseur of the shore!
During the identification session the atmosphere was really cool, we put on some music and had a good time together.
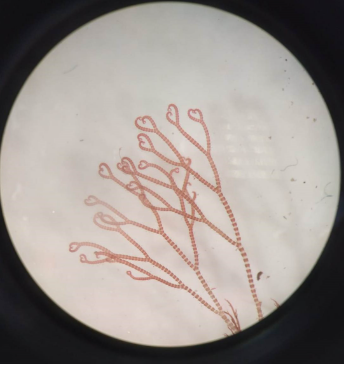
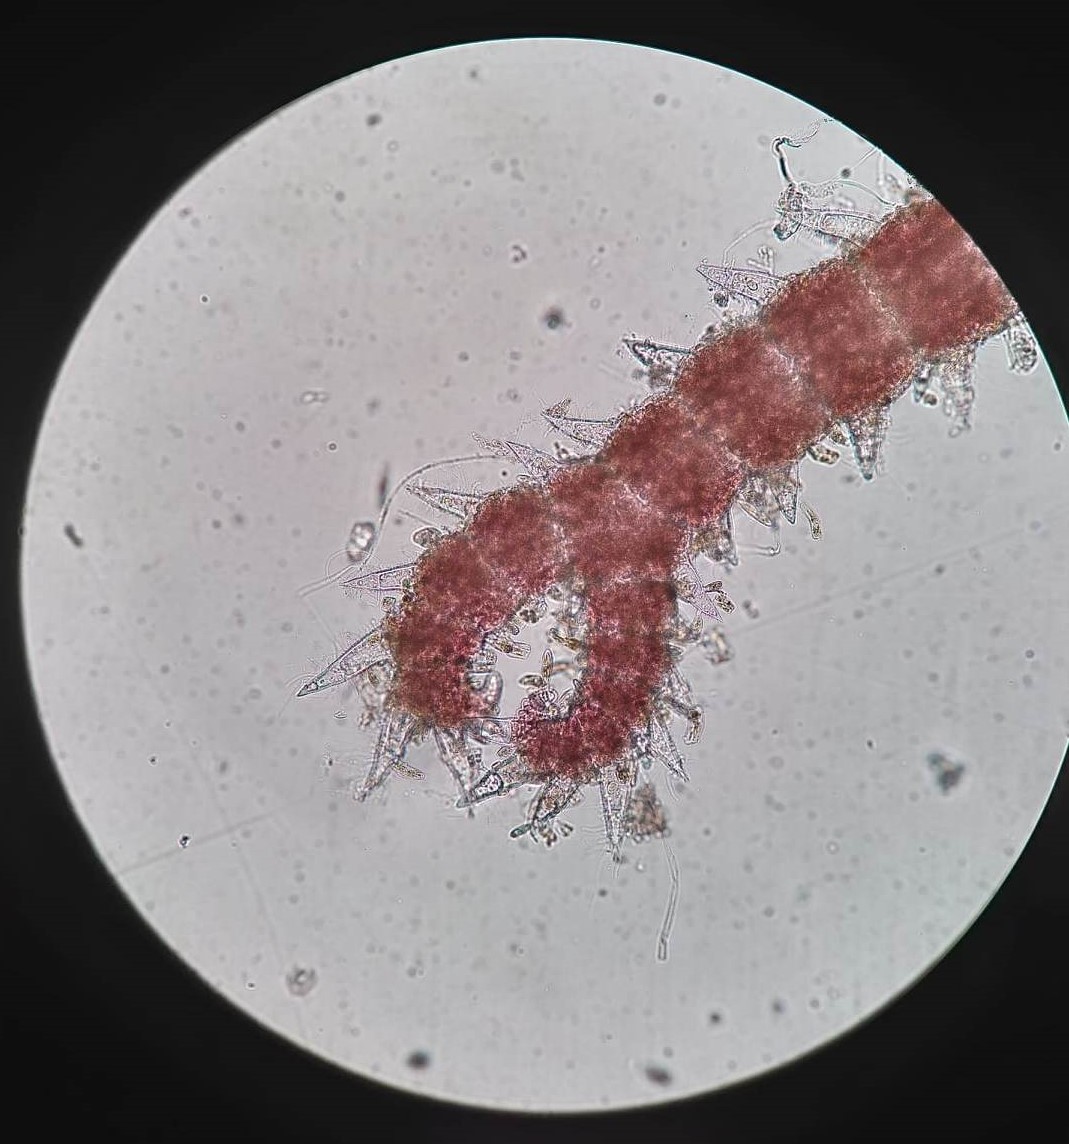
The shore is full of wonders, you just have to bend down to see them !
Here are some pretty examples of what Brittany coast can offer to your eyes.
 The Petit Minou lighthouse, Plouzané, Brittany Finistere ©Annaëlle Anquet


Data analysis
We then statistically analyzed the surveyed data using a spreadsheet (excel) and R software. For example, we performed Principal Component Analyses (PCA) to compare the distribution and density of organisms within each community and between communities. The objective of all the analyses was to highlight the distribution of species according to their bathymetric level and their recovery according to the community they belong to. Did you know that? There are several groups of macroalgae that differ by their characteristics: green, red and brown algae.
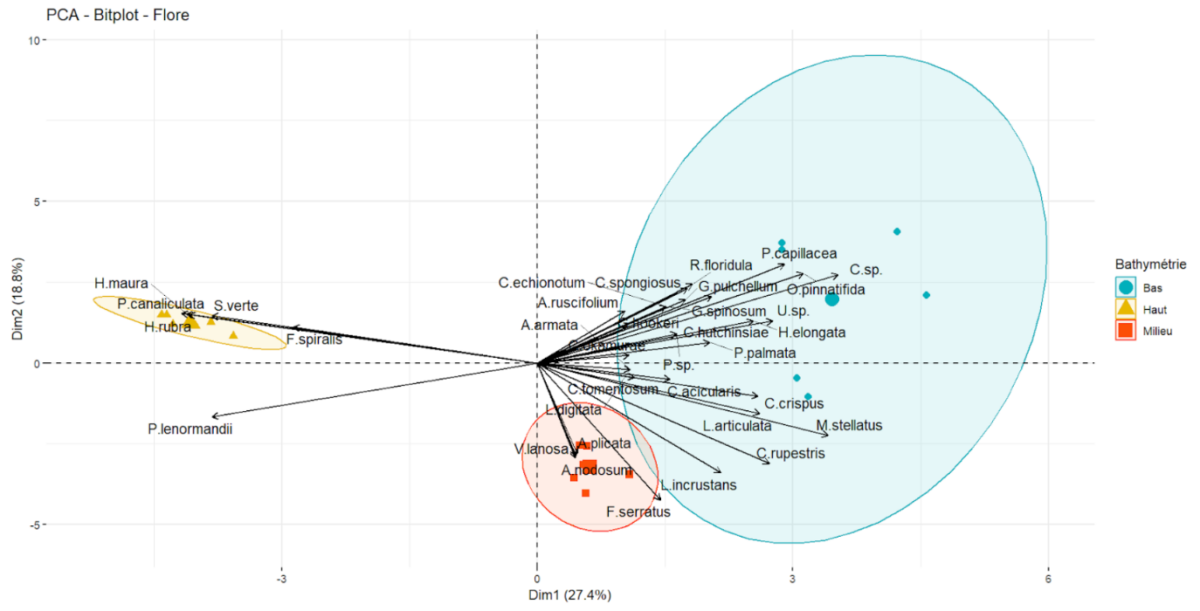
Here is the PCA we made for our report. It clearly shows the three levels of the shore: low, middle and high.
The ellipses surround the species that are found in each level and show that each bathymetric level has its own community.
Writing a report
After analyzing the data, we wrote a report entitled: Distribution of fauna and flora along a sheltered rocky shore. After introducing the subject, we explained the sampling methods and described the abundance of the different species observed on the shore. We performed statistical analyses and compared them to the literature. At the beginning, our results were rather logical for the flora but less so for the fauna, but by dint of looking for articles, we ended up understanding certain mechanisms explaining the location of certain species on the foreshore. We have highlighted a phenomenon of migration of gastropods to reach the bottom of the shore.
We were in a hurry to return the report and we left mistakes in it but Thomas kindly sent us an email to point out our mistakes. We corrected them and sent back the document.
We want to thank you for going this far, and we hope that this glimpse of our studies has enlight your curiosity for the shore and those beautiful seaweed !
The Team
Aurore Brossault
Nolwenn Béchennec
Amandine Bergot
Annaëlle Anquet
Fanny Ferron
Our university

 Attention, vous utilisez un navigateur peu sûr !