Why and what is the leg 2?

Authors: Angèle Nicolas, Luis Chomienne, Sara Sergi, Steven Herbette
Along the continental slope on the east coast of South Africa, a warm and salty surface current flows southward, the Agulhas Current. This is one of the strongest onshore currents on the planet, with velocities greater than 1.5 m/s, over a strip of about 1000 km wide and a few hundred meters thick. The presence of this current has a strong influence on the coastal ecosystems of the region, generating a significant variability of environmental conditions and dynamics. The temperature and salinity of the coastal waters, but also the intensity and direction of the currents on the shelf, vary according to the incursions of the Agulhas Current at the coast, the upwelling of deep waters generated by the friction of the current on the continental slope and the presence of cyclonic eddies on the eastern edge of the current. In addition to this variability associated with the current, there is also the dynamic due to the presence of internal waves.
Our objective for Leg 2 is to investigate whether there is a link between dynamic phenomena and the nature and abundance of marine species in these coastal ecosystems. We focus primarily on the response of the first links of the trophic chain, namely phytoplankton and zooplankton, whose response time to dynamic solicitations associated with, for example, a nutrient input is assumed to be sufficiently short to be captured on the time scale of the RESILIENCE campaign.
The region south of Durban (figure below) is a privileged site for studying the formation of cold cyclonic eddies trapped between the coast and the Agulhas Current, and for the generation of internal waves. It is also an area where many Marine Protected Areas (MPAs) are scattered along the coast. To better define their management policies, scientists need to have a better knowledge of their ecosystems and the connectivity between these different areas.
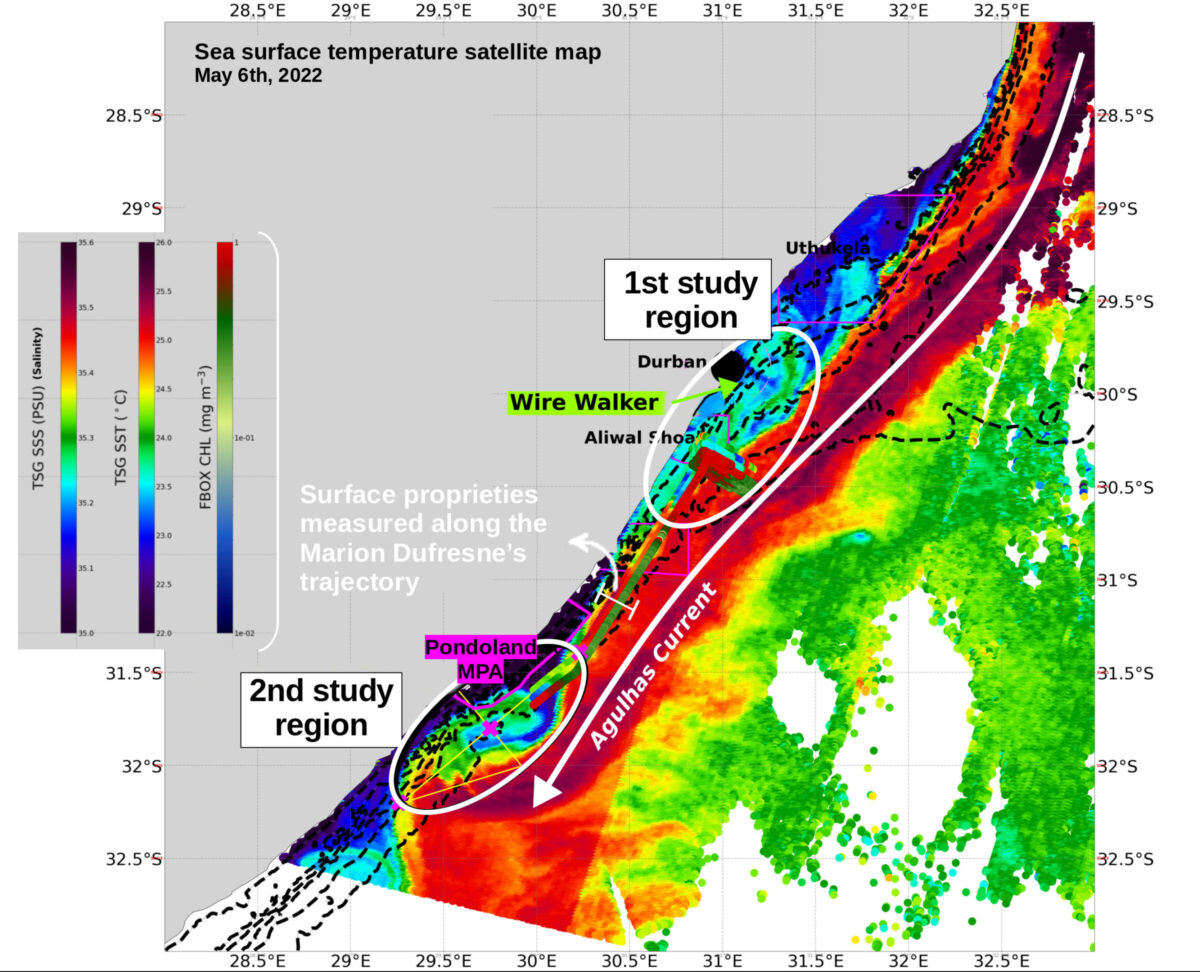
Map of sea surface temperature in the study regions of Leg 2. (c) Image adapted from a figure by Steven Herbette
Study of internal waves
To study the presence of internal waves and to better understand how these waves could influence the currents and stratification of coastal waters in the region, two devices were moored for the entire duration of Leg 2 (14 days), just south of Durban, in 60 meters of water. The Wire-Walker (see its professional resume for more information) is a device equipped with temperature, salinity and pressure sensors. It uses the mechanical energy of the waves to move up and down along a vertical cable to which it is attached, thus making continuous vertical profiles of temperature and salinity at a rate of one cycle every 10 minutes. Right next to it, an Acoustic Doppler Current Profiler (ADCP) was also moored to measure the vertical current profiles. The analysis of time series of current, temperature and salinity, carried out with high frequency sampling, will allow to better understand the dynamics of internal waves in the region, and to understand their generation mechanism. At the latitude of Durban (30°S), there is a resonance between the frequency of the diurnal forcing (sea breeze) and the inertial frequency. Recent studies at the same latitude on the west coast of South Africa have shown that this resonance leads to an amplification of the currents associated with inertial waves. Due to the presence of the coast, this resulted in the generation of internal waves. The jolts of the thermocline and the vertical shear of the currents associated with these waves favored the vertical mixing and consequently the production of phytoplankton by enriching the surface layers illuminated by light with nutrients. The figure below represents the raw time series obtained with the wire-walker: one can see the strong variability of the water masses in time, and the high frequency of this variability.

Study of a sub-mesoscale cyclonic eddy: the Durban eddy
In the framework of their master and doctorate respectively, Nasreen and Gustav are studying the dynamics of this eddy and allowed us to learn more about it during their seminar on board the Marion. These eddies are regularly born south of Durban. They can remain trapped in place until they dissipate or grow until they reach a critical size of a few tens of kilometers and then detach from the region and be carried south for several tens of kilometers. Of elliptical shape, they are at the origin of an intense coastal counter-current directed towards the north and characterized by speeds of about 1m/s. On the northern and southern flanks of this eddy, the induced velocities are cross-shore and responsible for important exchanges between the cold, nutrient-rich coastal waters and the warm, salty, nutrient-depleted waters of the Eel Current (this is called an oligotrophic environment, from the Greek oligo “little” and trophein “to feed”). As the eddies move south, they could carry nutrients and living organisms with them, connecting the various marine protected areas in the region. These eddies are also expected to create local upwelling of deep water on these flanks, which could influence primary production.
When we arrived at the site, the large eddy that had been in place for several weeks had broken off and moved further south. After spending 2 days sampling the area where the eddy had formed, hoping eventually that a new eddy would form, we decided to “catch up” further south with the already formed Durban eddy (study area 2 in the Pondoland MPA in Figure 1). One of the major challenges of the campaign was to successfully track and sample a moving eddy, sometimes traveling more than 20 km in one day. Once the eddy was located, 4 drifting buoys were also launched into the eddy in the hope that they would become trapped there. Scientists received the positions of these buoys every hour, which allowed for real-time adjustments to the sampling strategy and vessel position. These buoys also measured the temperature, making it possible to follow the evolution of the properties of the water mass trapped in the eddy. The sampling strategy implemented consisted in performing very close “radiator” radials on the eddy in order to obtain a high resolution mapping of its properties. Indeed, along the trajectory of the Marion Dufresne, many instruments perform quasi-continuous measurements (see the colored lines showing the passage of the Marion on the maps below). The ADCP of the hull, emitting at 150kHz, allows to measure the velocities on the first 150 meters of the water column. By performing radials, physicists obtain a mapping of horizontal velocities and can thus reconstruct the synoptic flow. In addition, the MVP (Mobile Vessel Profiler), towed at the back of the boat (its professional resume is also published on this site), performs a vertical profile of temperature, salinity and fluorescence every 6 minutes to a depth of 300 m. Under certain assumptions, it is then possible to indirectly deduce the vertical velocities from the spatial density gradients. These vertical velocities, of the order of mm/s, are far too low to be measured directly.


 Attention, vous utilisez un navigateur peu sûr !